Temporal analysis of hotel KPIs allows you to see data not just as isolated figures, but as stories unfolding over time. This perspective brings clarity, context, and enables more precise decision-making. Here, we explain what it is, how to do it, why it matters, which tools to use, common mistakes, and how we approach it at Dataria.
1. What is temporal analysis of hotel KPIs?
Temporal analysis involves tracking the evolution of key indicators—such as RevPAR, ADR, occupancy, or pickup—over time. It’s not just about recording numbers; it’s about understanding how, why, and when they change.
This approach helps identify patterns, anticipate demand peaks, and spot deviations from previous periods or planned projections.
2. How is it done?
Effective temporal analysis follows a few key steps:
- Choose the right time scale: day, week, month, or year, depending on your goal.
- Compare with historical references: LY (last year), SDLY, Budget, or Forecast.
- Break down the data: by segments, sales channels, customer types, or pickup.
- Spot signals of change: use alerts or indicators to highlight trends or deviations.
- Dive deeper when needed: expand a day, week, or month to explore the details behind the numbers.
This methodology turns hotel revenue KPIs from raw statistics into actionable insights.
3. Why is it important?
Temporal analysis provides strategic advantages:
- Identify patterns: know when results occur and what drives them.
- Make proactive decisions: spot trends before they impact revenue.
- Plan with context: align operational, tactical, and strategic choices with the business’s real trajectory.
- Understand event impacts: see how fairs, campaigns, or holidays affect daily KPIs.
In short, it brings clarity and perspective, turning data into more accurate and effective decisions.
4. Which tools are used?
Traditionally, this analysis relied on complex spreadsheets or multiple dashboards. Today, hotel Business Intelligence tools allow you to centralise and visualise information clearly and quickly.
A good system should offer:
- Interactive time-based KPI visualisation
- Automatic comparisons with previous periods or forecasts
- Breakdown by segments, channels, and pickup
- Alerts and visual performance signals
- Direct access to dashboards for deeper KPI analysis
With a BI system, you can centralise all your data in one panel, streamlining every step. Hotel-specific BI also enables automatic comparisons, visual alerts, filters by segment or channel, and deep dives into any time period with a single click. KPIs stop being isolated figures and start telling the full story—revealing patterns, trends, and opportunities that might otherwise go unnoticed.
5. Common mistakes in temporal KPI analysis of hotel KPIS
Frequent errors that limit the value of temporal analysis include:
- Focusing only on isolated figures without temporal context
- Comparing different periods without normalising data, leading to misleading conclusions
- Ignoring segmentation, which can hide issues or opportunities in specific channels or customer types
- Overlooking key events (holidays, campaigns, price changes) that affect performance
- Not using a centralised tool, scattering information and complicating decision-making
Avoiding these mistakes ensures temporal analysis becomes a genuine driver of strategic insights.
6. Dataria’s approach
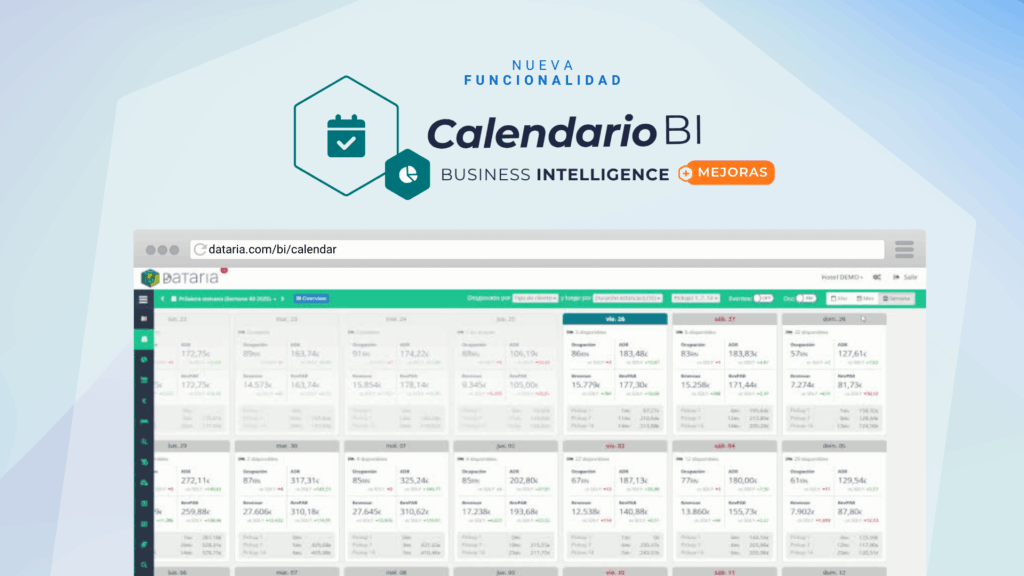
At Dataria, we’ve created the KPI BI Calendar, a view that makes temporal analysis straightforward:
- Visualise your KPIs by day, week, month, or year in an interactive calendar
- Easily compare with LY, SDLY, Budget, or Forecast
- Break down data by segments, channels, and pickup for a complete view of your business
- Use the Overview button to summarise key KPIs based on the selected view
- Access the dashboard directly to dive deeper into any KPI without losing calendar context
- Incorporate key events and analyse their impact on your metrics
In short, the BI Calendar transforms KPIs into a time-based dashboard within our hotel Business Intelligence suite—where every data point has its place, and every decision its moment. Book a DEMO to explore it in depth with our team.
In short, the BI Calendar turns KPIs into a temporary board part of our Hotel Business Intelligence, where each data has its place and each decision its moment. Do you want to know more about it? Schedule a demo And discover it in depth guided by our team.